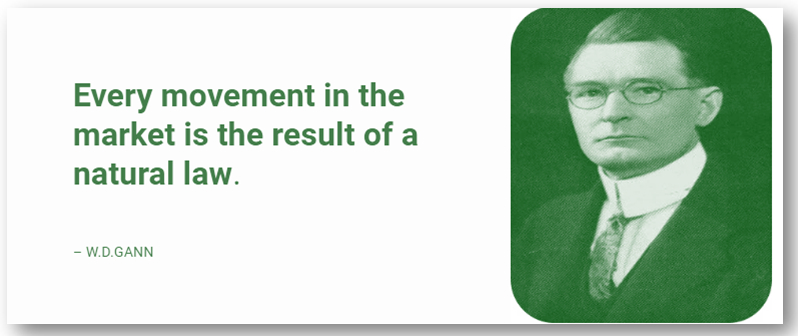
Who Was W.D. Gann? The Trader Who Predicted Markets with Math

When it comes to legendary figures in the world of trading, few names resonate as profoundly as W.D. Gann. Many traders and investors often ponder, who was W.D. Gann? Known for his unique approach that combined mathematics, geometry, and astrology, Gann made predictions that astonished the financial community. His techniques have inspired countless traders across … Read more

Is WD Gann Theory Still Relevant for Modern Markets?

In the ever-evolving landscape of trading, one question that frequently arises among traders is, “is Gann theory still relevant?” Developed by the legendary trader W.D. Gann in the early 20th century, this theory has intrigued many due to its unique approach to market analysis. Gann’s techniques, which include mathematical angles, time cycles, and price levels, … Read more

What Caused NIFTY to Rise Today? 30 July 2026

What Factors Contributed to Today’s Rise in NIFTY?

W.D. Gann and his Square of 9 degree based technique provide valuable insights into stock market movements. Today, NIFTY experienced a notable rise, first hitting a low at 315 degrees at exactly 09:16 AM with a price of 24,187. Later in the day, the market reached a high at 135 degrees precisely at 03:26 PM, recording a price of 24,343. Understanding these degrees is crucial for making informed trading decisions, with price serving as support for those degrees.

Gann Time and Price Analysis

The market showed a range degree of 90 degrees, indicating a range of 156 points for today. Additionally, the time Square or SQR degree was marked at 0 degrees, contributing further insights into market timing.

Today’s Key Levels

The key pivot level today was identified at 24,103, offering a reference point for traders. Additionally, buy above was set at 24,125, while sell below was defined at 24,082, guiding the trading strategy for the day.

Learn W.D. Gann Technique

The W.D. Gann technique teaches traders to analyze market movements through precise angles and degrees. This method helps in identifying key support and resistance levels, enhancing the ability to make strategic trading decisions based on time and price alignment.

Follow Us For Daily Gann Analysis

We break down NIFTY every trading day using W.D. Gann’s time tested principles. Join our community for daily insights.

📸 Follow on Instagram ▶️ Subscribe on YouTube

Master W.D. Gann Technique

If you want to go beyond daily posts and truly learn to apply this technique yourself, join our structured course. Learn Square of 9, Time SQR, and Price SQR step by step.

🎓 Join the W.D. Gann Course

Disclaimer: This content is shared purely for educational purposes and should not be treated as investment advice. We are not SEBI registered research analysts or investment advisors. Please consult a qualified financial advisor before making any trading or investment decisions.

KooCapital.Com

What Caused NIFTY’s Decline Today? 22 July 2026

What Influenced Today’s Decline in NIFTY?

W.D. Gann’s Square of 9 degrees based technique provides a unique lens through which to examine the fluctuations in the NIFTY index. Today, the market reached a high at 360 degrees, precisely at 09:21 AM, with a price of 24,166. Later, the market fell to a low at 0 degrees, occurring at 12:41 PM, when the price settled at 23,961. This movement from high to low reflects the power of understanding degrees in market dynamics, where price is secondary but the degree of movement is key.

Gann Time and Price Analysis

The day’s range degree was calculated at 120 degrees, showing a range of 205 points from the high to the low. At the same time, the time SQR degree registered at 0 degrees, indicating a notable transition during the trading session.

Today’s Key Levels

The pivot point for today’s session was set at 24,103. Key levels for traders include sell below at 24,082 and buy above at 24,125, providing essential markers for decision making in the trading strategy.

Learn W.D. Gann Technique

This technique teaches traders to harness the relationship between time and price, emphasizing the significance of degrees in market behavior. By understanding these elements, traders can enhance their market analysis and improve their decision making in volatile conditions.

Follow Us For Daily Gann Analysis

We break down NIFTY every trading day using W.D. Gann’s time tested principles. Join our community for daily insights.

📸 Follow on Instagram ▶️ Subscribe on YouTube

Master W.D. Gann Technique

If you want to go beyond daily posts and truly learn to apply this technique yourself, join our structured course. Learn Square of 9, Time SQR, and Price SQR step by step.

🎓 Join the W.D. Gann Course

Disclaimer: This content is shared purely for educational purposes and should not be treated as investment advice. We are not SEBI registered research analysts or investment advisors. Please consult a qualified financial advisor before making any trading or investment decisions.

KooCapital.Com

What Caused the NIFTY Drop Today 21 July 2026

Why Did NIFTY Experience a Decline Today

W.D. Gann’s Square of 9 degree based technique offers valuable insights into market movements, evident in today’s NIFTY activity. The market reached its high degree at 330 degrees, occurring at exactly 09:19 AM when the price touched 24,262. Conversely, the market fell to a low degree of 270 degrees, recorded at precisely 01:01 PM with the price dropping to 24,136. Observing the degrees is crucial for understanding market behavior, while price levels substantiate these movements.

Gann Time and Price Analysis

The market exhibited a range degree of 72 degrees, resulting in a range of 126 points throughout the trading day. Additionally, the time Square degree was logged at 216 degrees, highlighting the strong correlation between time and price movements.

Today’s Key Levels

The pivot point for today stood at 24,104, with a buy signal above 24,125 and a sell signal below 24,082. These levels are essential for traders looking to navigate the market based on Gann’s principles.

Learn W.D. Gann Technique

The W.D. Gann technique teaches traders to analyze market movements using the interrelationship between time, price, and angles. This approach allows for a deeper understanding of market dynamics and helps traders make informed decisions based on historical patterns.

Follow Us For Daily Gann Analysis

We break down NIFTY every trading day using W.D. Gann’s time tested principles. Join our community for daily insights.

📸 Follow on Instagram ▶️ Subscribe on YouTube

Master W.D. Gann Technique

If you want to go beyond daily posts and truly learn to apply this technique yourself, join our structured course. Learn Square of 9, Time SQR, and Price SQR step by step.

🎓 Join the W.D. Gann Course

Disclaimer: This content is shared purely for educational purposes and should not be treated as investment advice. We are not SEBI registered research analysts or investment advisors. Please consult a qualified financial advisor before making any trading or investment decisions.

KooCapital.Com

Gann Trading Course Online – Learn Market Prediction Step by Step

Gann Trading Course Online – Learn Market Prediction Step by Step

The Gann Trading Course Online helps traders understand how to predict market movements using time and price principles. This method focuses on structured analysis instead of guesswork.

In this course, you will learn how to apply Gann theory, identify key levels, and use practical techniques in real market conditions. It is suitable for both beginners and experienced traders.

Gann Trading Course Online

WD Gann Trading Course Online – Complete Learning Guide

This WD Gann Trading Course Online helps traders understand time price analysis, Gann angles, square of nine, and real market strategies. Below are key concepts covered in this training.

Gann Angle Course

Gann Angle Course for Time Price Analysis

Gann Strategy Course

Gann Trading Strategy Course Online

Gann Trading Course Online

Gann Trading Course Online for Market Prediction

Online Gann Trading Training

Online Gann Trading Training Program

Square of Nine Training

Square of Nine Gann Training Course

WD Gann Trading Course Online

WD Gann Trading Course Online with Practical Training

This course is designed for traders who want structured learning and practical application of Gann theory.

Join WD Gann Trading Course Online

For complete training, check the full course below.

Join WD Gann Trading Course Online

Gann Strategy Course – Learn Time Price Trading Techniques

Gann Strategy Course – Learn Time Price Trading Techniques

The Gann Strategy Course is designed for traders who want to understand how markets move using time and price principles. Gann methods help in identifying trend direction, entry points, and strong price movements.

In this course, you will learn practical techniques based on Gann theory, including time cycles, price levels, and real market applications. This helps you move from guesswork to structured trading.

Gann Strategy Course

For complete learning, explore our full course below.

Join WD Gann Trading Course Online

Gann Angle Course – Learn Price Time Balance in Trading

Gann Angle Course

Gann Angle Course – Learn Price Time Balance in Trading

This Gann Angle Course helps traders understand how price and time move together in the market. Using Gann angles, you can identify trend direction, support resistance, and strong market movements with clarity.

In this training, you will learn how to draw Gann angles correctly, apply them on charts, and use them in real market conditions. This is practical learning designed for traders who want better decision making.

Gann Angle Course
Gann Angle Course

If you want to go deeper into complete strategy, check our full course below.

Join WD Gann Trading Course Online

WD Gann Mastery Course – Learn to Predict Markets Using Excel VBA and NSE Live Data

KooCapital – Live Course

WD Gann Mastery Course
with Excel VBA & NSE Live Data

Master Time & Price Analysis, Gann Angles, Square of Nine and Market Technique with live practical training – all built in Excel.

5 Hours Live 1-on-1 Training Excel VBA Tools NSE Live Data Beginner to Advanced
View Full Course Details →

WD Gann is one of the most powerful and least understood methods in market analysis. Most traders have heard of Gann theory but very few have ever learned it correctly – and even fewer know how to apply it using modern tools like Microsoft Excel and VBA automation.

At KooCapital we have built a complete WD Gann Mastery Course that teaches the entire Gann system from scratch using Excel formulas, VBA functions and live NSE market data – making it the most practical Gann course available in India today.

What Is the WD Gann Mastery Course?

The WD Gann Mastery Course is a 5-hour live 1-on-1 online training programme taught personally by Ajit Kumar – a WD Gann expert and Excel VBA specialist with over 10 years of market experience.

This is not a group class and not a pre-recorded video. Every session is conducted live with you personally, tailored to your own stocks and trading style, and scheduled at a time that suits you completely.

The course covers the complete Gann system – all implemented directly in Microsoft Excel using formulas and VBA automation so every concept is instantly clear and immediately usable.

What You Will Learn

📐

Price Square in Excel

Square root any price, add or subtract fractions, resquare – instantly get exact support, resistance and vibration levels for any NSE stock using a simple Excel formula.

⏱️

Time Square in Excel

Apply square root mathematics to time to predict future reversal dates weeks ahead. Fully automated in Excel with a VBA function – one input gives you the turning point date.

🌀

Square of Nine – Full Excel Build

Complete Square of Nine spiral grid built in Excel. Enter any price and get cardinal cross targets, diagonal vibration levels and degree conversions automatically.

📏

Gann Angles with Excel Scaling

Calculate all major Gann Angles (1×1, 2×1, 1×2) using Excel coordinate formulas. Draw and use them as mathematically precise dynamic support and resistance on any chart.

📡

NSE Live Data in Excel

Pull live NSE market prices directly into your Gann Excel sheet. All levels, angles and time targets update in real time every session – zero manual entry required.

🔲

Level Square

Square key price numbers to find hidden support and resistance zones that only Gann trained traders can identify – invisible to all conventional technical analysis tools.

🎯

Predict Up and Down Move Points

Spot exact time-price intersections where strong moves start – confirmed across Price Square, Time Square and Gann Angles simultaneously in Excel.

⚙️

Excel VBA Automation

Every concept is automated with custom VBA functions. Enter a price or date and calculations appear instantly. All tools and workbooks are provided and yours to keep forever.

Master the Power to Predict Markets

Turn complex Gann geometry into clear, actionable predictions. After completing this course you will have eight powerful prediction abilities that give you an edge no conventional analyst possesses.

🚀 Predict Next Big MovesSpot early market vibrations and forecast turning points before they appear on any chart.
⏸️ Predict Price Not to MoveRecognize time-price balance zones where the market takes a rest and avoid false breakouts.
⚡ Predict Price Will Move FasterIdentify acceleration phases using time compression and Gann angles before they explode.
📐 Learn the 45° ConceptUnderstand the equilibrium between time and price using Gann’s 45° rule on any market.
🔼 Predict Up Move PointsLocate the key angles and cycles where bullish moves begin with mathematical precision.
🔽 Predict Down Move PointsDetect timing and resistance levels before market corrections start and exit ahead of the crowd.
📊 Price More, Time LessIdentify overextended price moves where correction or pause is near before it happens.
⏳ Time More, Price LessSpot long duration consolidations that signal powerful upcoming moves before they break out.

Course Details

Format Live 1-on-1 online training with Ajit Kumar personally
Duration 5 hours total, scheduled at your convenience
Language English with Hindi explanations wherever needed
Recording Full session recording provided after every session
Tools Included Custom Excel VBA workbooks and tools – yours to keep forever
Support Post course WhatsApp support for follow up doubts
Markets NSE stocks, Nifty, BankNifty, Forex, commodities, crypto
Course Fee ₹85,000 – One time, all inclusive

About Your Instructor – Ajit Kumar

Ajit Kumar is a WD Gann researcher, trader and educator who has spent over 10 years decoding Gann’s original methods into a practical, repeatable trading system built entirely in Excel.

His unique advantage is combining deep Gann knowledge with Excel VBA mastery – making him one of the very few Gann teachers in India who can show you not just the theory but the complete automated Excel implementation that works every trading day.

✓ WD Gann Time-Price Expert ✓ Excel VBA Automation Specialist ✓ 10+ Years Market Experience ✓ NSE Data and Excel Systems Builder ✓ Live 1-on-1 Mentorship Coach

What Traders and Learners Say

★★★★★

“The Excel VBA tool for Square of Nine is incredible. I enter a price and all my Gann levels appear instantly. I will never go back to manual calculation.”

Rahul Mehta 🇮🇳 Swing Trader, Mumbai
★★★★★

“Learning to pull NSE live data into my Gann Excel sheet was a game changer. My analysis is now fully automated and real time. Brilliant course.”

Neha Arora 🇮🇳 Intraday Trader, Delhi
★★★★★

“The Time Square VBA function predicted the exact Nifty reversal date I was watching. The combination of Gann theory and Excel makes this course truly unique.”

Sanjay Verma 🇮🇳 Positional Trader, Pune
★★★★★

“Two years of YouTube Gann videos did not help. One 1-on-1 Excel session with Ajit made everything click. Worth every rupee, 100 times over.”

Li Wei 🇸🇬 Forex Trader, Singapore

Frequently Asked Questions

Is this course suitable for beginners?

Yes. The course is structured from beginner to advanced level. You need only basic awareness of stock markets and Excel. Ajit Kumar teaches step by step with live Excel demonstrations.

Will I receive the session recording?

Yes. All 5 hours of live sessions are fully recorded and provided to you so you can review any formula, VBA function or chart demonstration as many times as you need.

Which markets does this course apply to?

All markets. Primary examples use NSE stocks and indices including Nifty and BankNifty. The same Excel formulas apply to Forex, commodities and cryptocurrency with no changes needed.

What software do I need?

Microsoft Excel 2016 or newer with Windows recommended for full VBA support and any standard charting platform such as TradingView or Zerodha Kite. All VBA tools and workbooks are provided.

Can I ask doubts after the course ends?

Yes. All enrolled learners receive post course WhatsApp support from Ajit Kumar for follow up questions on topics covered during the sessions.

How do I enroll?

Contact Ajit Kumar directly on WhatsApp at +91 96544 21288 or email koocapitals@gmail.com to confirm your seat, arrange payment and schedule your sessions at a time convenient for you.

Ready to Predict Markets With Excel Precision?

Traders and learners from India and worldwide now forecast time, price and turns using Gann in Excel. Get your complete automated system in 5 hours of live 1-on-1 training.

+91 96544 21288  |  koocapitals@gmail.com

WD Gann Theory Training Course (With Excel VBA Automation) in Hindi & English

William-Delbert-Gann-WD-Gann-KooCapital.com

Learn WD Gann techniques with real calculations and predict stock movements yourself. Believe in the Time Wheel, Square of Nine, and Range Square. Understand how to identify turning points in price by mastering Gann’s principles, which emphasize the interconnectedness of price, time, and pattern analysis.